Bulk Density–Calibrated Fiber Networks Reveal Local Weakness as the Driver of Protease-Dependent Aortic Failure
Abstract
The mechanical integrity of the aortic wall depends on the microstructural organization of its collagen and elastin networks, which together maintain load-bearing capacity under hemodynamic stress. When this structure becomes heterogeneous through disease or proteolytic degradation, localized stress concentrations can precipitate failure, yet the mechanisms linking microscale density variations to macroscopic failure remain poorly defined. In this study, we combined density-driven finite element modeling and spatial statistical analysis to investigate how microstructural disorder contributes to mechanical failure in porcine aortic tissue. Representative volume elements incorporating experimentally derived collagen and elastin distributions were constructed and subjected to uniaxial loading simulations. Protease treatments (collagenase and elastase) were modeled by selectively degrading collagen or elastin fibers, respectively. Moran’s I analysis was used to quantify spatial autocorrelation of modeled fiber-density fields and to assess changes in microstructural spatial coherence. Protease treatment reduced fiber volume fraction and decreased positive Moran’s I, indicating a shift from more spatially clustered fiber organization toward less spatially correlated density fields. Finite element analysis revealed that protease-informed reductions in local fiber density altered load sharing, produced localized stress amplification, and promoted earlier damage initiation in the model. These findings support a mechanistic link between spatial fiber-density organization and local mechanical vulnerability in aortic tissue.
Motivation
Aortic dissection and aneurysm rupture happen when local wall stress exceeds local tissue strength. Classical failure theories assume a homogeneous material and use stress or strain to mark the onset of damage, but this is hard to apply to aortic tissue: the in-vivo reference stress is unknown and the microstructure is strongly heterogeneous. Experimental strength studies give overall tissue strength but do not explain how spatial variations in microstructure create local weak spots.
The authors' earlier experiments showed that a drop in bulk tissue mass density after protease treatment goes with lower aortic strength. Building on that result, and on work by Alagappan and Rajagopal linking damage initiation in polymers and elastomers to regions of lower density, this study tests computationally the hypothesis that regions of lower local fiber density are weaker and more likely to initiate damage.
Methodology
- Experimental basis: previously published tests on fresh porcine thoracic aorta. Axial strips from each aorta were given a 24-hour sham (PBS), collagenase or elastase treatment, their bulk mass density was measured before and after, and they were tested in uniaxial tension to failure. These data were used to calibrate and check the models.
- Fiber-embedded finite element model: a 250 μm cubic representative volume element (RVE) in which collagen and elastin fibers are 1D rod elements embedded in 8-noded hexahedral matrix elements (meshed in Cubit), with no slip between fibers and matrix. Fibers were placed by random ray shooting until the target volume fraction was reached, aligned with the loading direction with an average angular dispersion of 10°.
- Sham network: 25% collagen volume fraction (5000 fibers, 2 μm diameter) and 27% elastin volume fraction (22000 fibers, 1 μm diameter).
- Constitutive models: the matrix is a nearly incompressible neo-Hookean material with a shear modulus of 16.07 kPa. Fiber stress is zero below the recruitment stretch and then rises linearly with the true fiber stretch, scaled by a damage variable S. S is 1 up to the peak fiber stretch λp and falls linearly to zero at the maximum stretch λmax = λp + 0.1, after which the fiber is broken. λp was 1.2 for collagen and 2.5 for elastin.
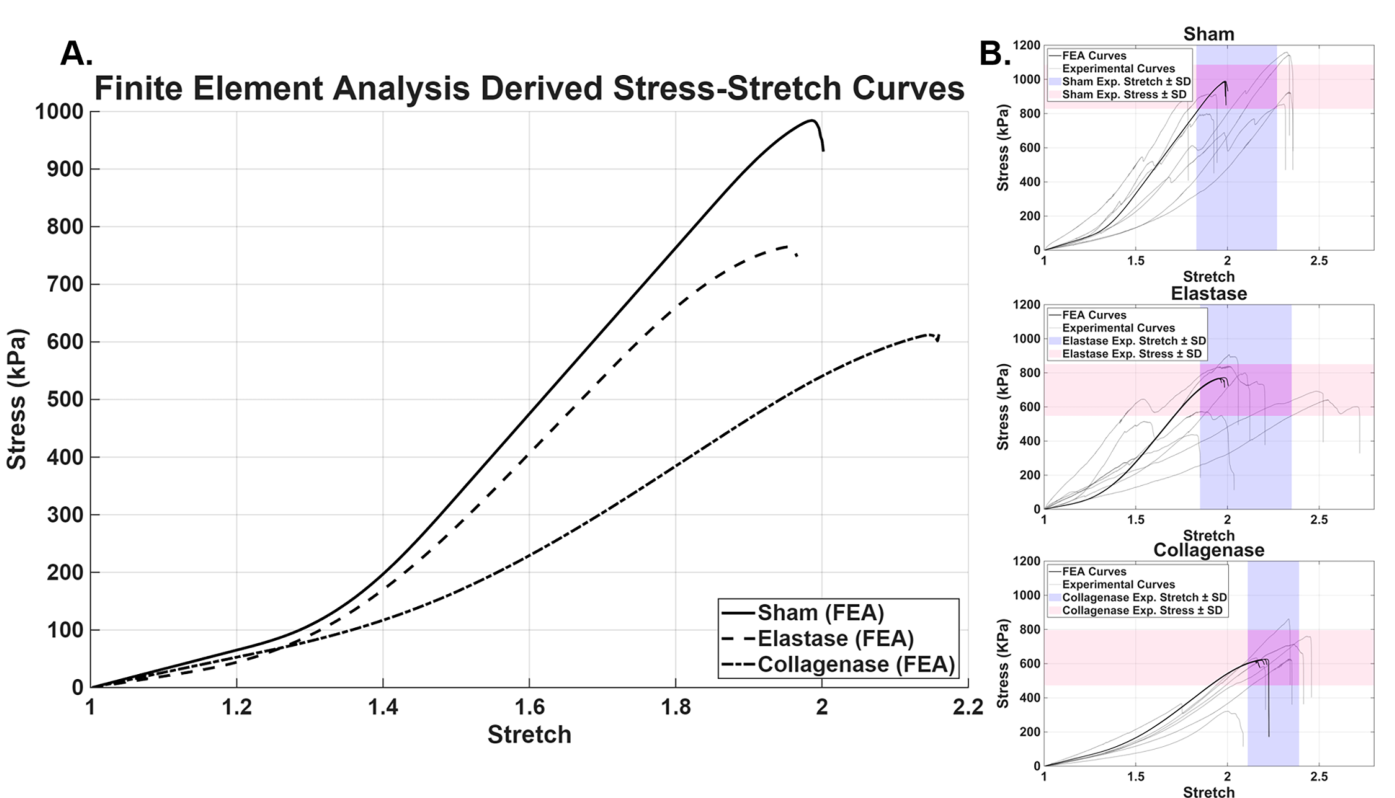
- Calibration: collagen and elastin fiber stiffnesses were fitted to the mean sham stress–stretch curve and then held fixed for the protease cases.
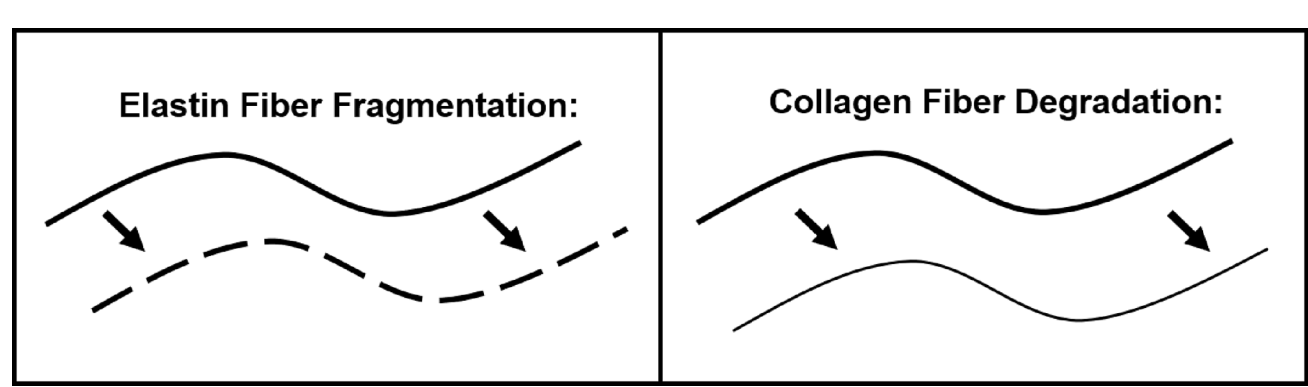
- Protease-informed networks: elastase was modeled by randomly removing segments from elastin fibers, and collagenase by uniformly reducing collagen fiber diameter. These changes were applied to the unloaded network before uniaxial loading. Five independent RVE realizations were run for each condition.
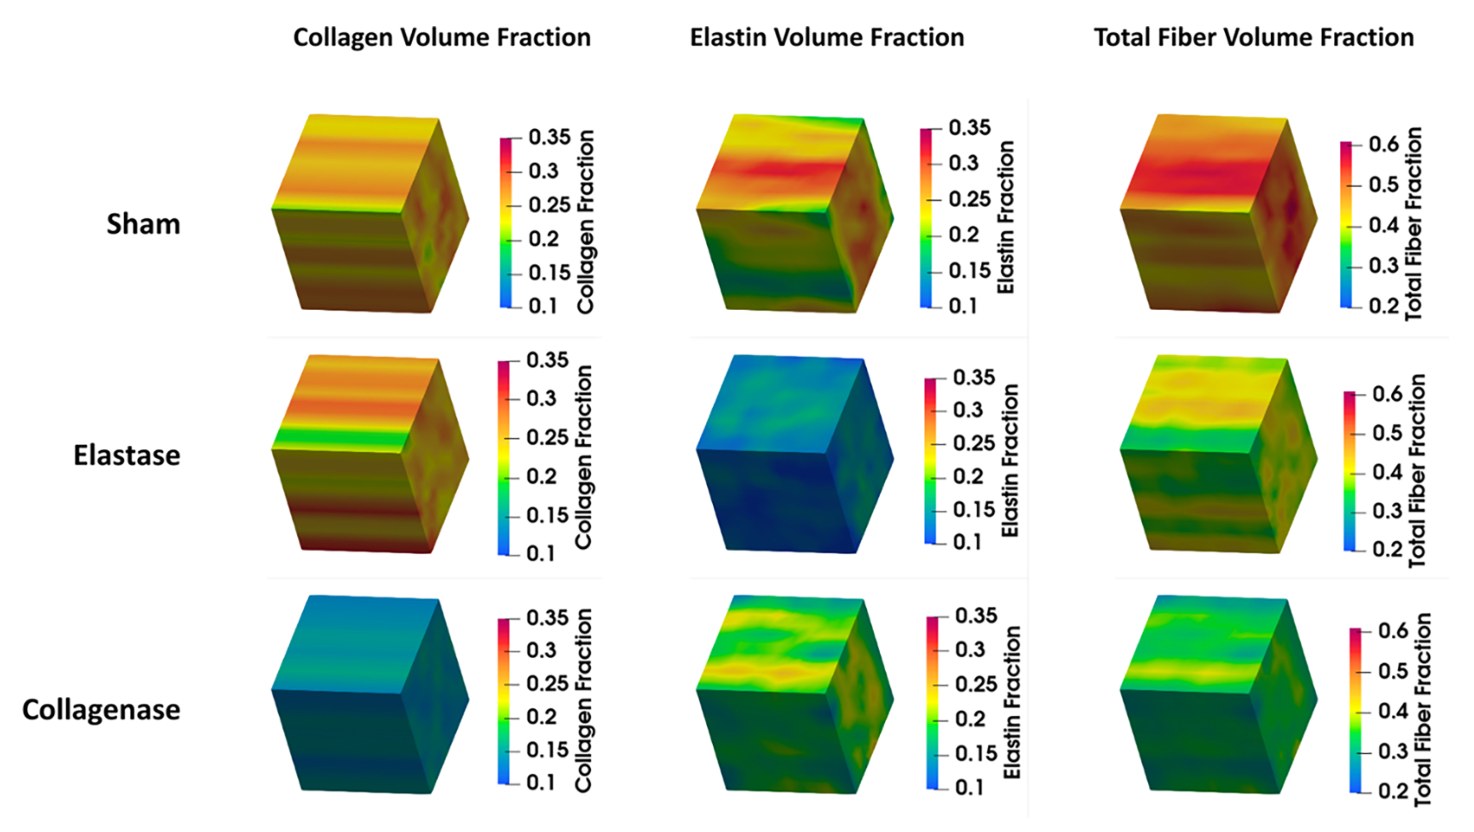
- Spatial statistics: each RVE was divided into 10 × 10 × 10 voxels (25 μm side) and the local collagen, elastin and total fiber density was computed per voxel. Global Moran’s I, which ranges from −1 (dispersed) through 0 (random) to +1 (clustered), was computed with a distance weighting truncated at 25 μm, so only immediate neighbors contribute. Significance was tested against 999 random permutations of the voxel values.
Key Findings
- Calibrated fiber properties: fiber stiffness Ef = 6 MPa for collagen and 1.2 MPa for elastin. Elastase reduced elastin volume fraction from 27% to about 15%. Collagenase reduced collagen fiber diameter from 2 μm to 1.5 μm (volume fraction from 25% to about 14%), with a secondary drop in elastin from 27% to about 21%.
- Bulk response: simulated failure stress and stretch fell within one standard deviation of the experiments for all groups. Sham failed at the highest stress (~950 kPa, stretch ≈ 2.0). Elastase-treated tissue failed at ~750 kPa with a similar stretch (≈ 2.0). Collagenase-treated tissue failed at the lowest stress (~650 kPa) but the highest stretch (≈ 2.2), showing a more compliant wall.
- Spatial organization: Moran’s I showed significant positive spatial autocorrelation in all groups (p ≈ 0), so fiber density is clustered rather than random. It was highest in sham (collagen 0.5251, elastin 0.4443). Elastase lowered it to 0.4339 for collagen and 0.304 for elastin, and collagenase to 0.3993 for collagen and 0.3696 for elastin.
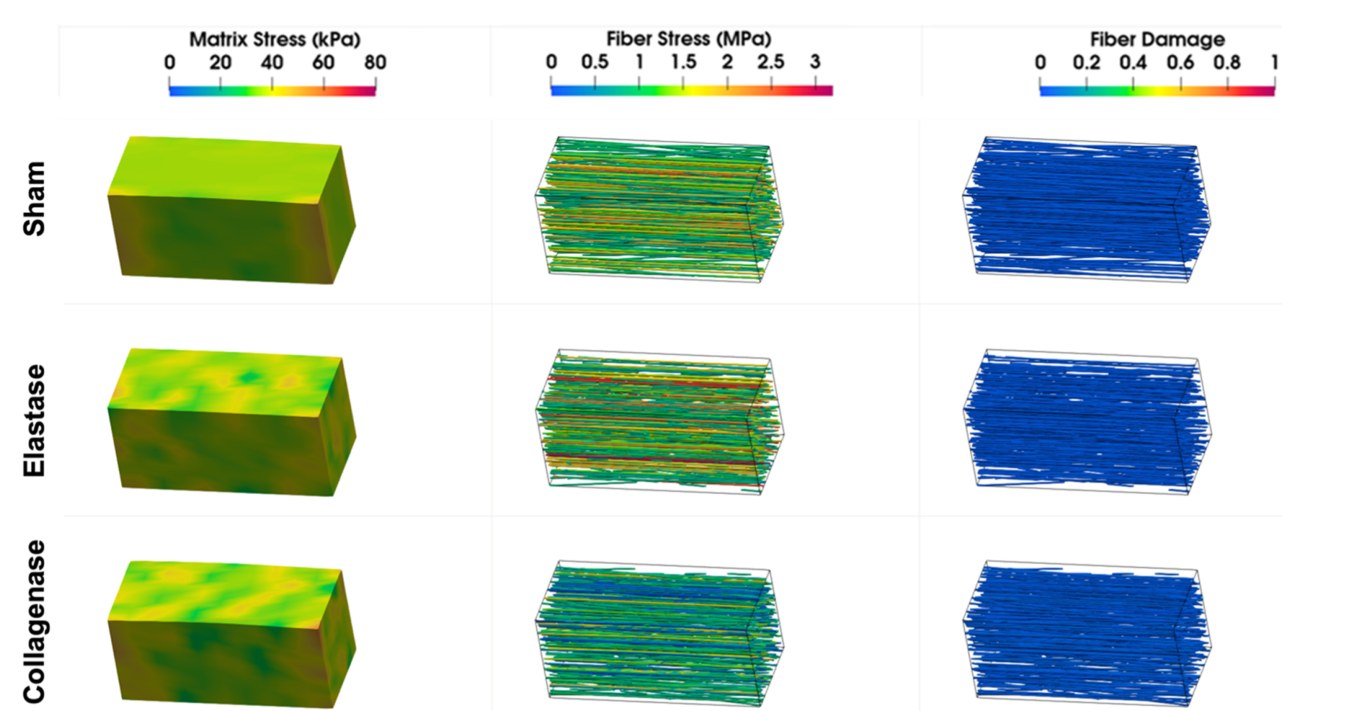
- Local stresses and damage: in sham, matrix stress rose fairly uniformly while fiber stress became more heterogeneous, with localized fiber damage appearing only at the last stable stretch (λ = 1.98). Both protease groups showed earlier stress heterogeneity. Just before failure (λ = 1.99 for elastase, 2.18 for collagenase), fiber stress exceeded 2.5 MPa in several regions and early fiber damage appeared in high-stress regions.
- Mechanism: in both protease cases, failure began at locally elevated stresses that arose from fluctuations in fiber density, which the drop in Moran’s I captures. The results suggest that collagen mainly sets strength and stiffness, while elastin governs extensibility and helps even out stress.
Conclusions
Protease-informed reductions in local fiber density and spatial coherence produced localized stress amplification and earlier damage initiation in modeled aortic tissue. Failure therefore depends not only on how much collagen and elastin the wall contains but on how coherently those fibers are arranged. Combining density-based fiber-level finite element modeling with Moran’s I analysis gives a quantitative way to study how disordered microstructure creates local mechanical weakness. Unlike stress- or strain-based criteria, a relative density measure does not need information from the unknown reference configuration.
The authors note that the density fields were generated in computational RVEs informed by measured volume fractions rather than segmented from images, and that the simulations test how prescribed microstructural changes propagate through the model rather than prove that low-density regions always fail first. Future work will extract spatial correlation statistics from multiphoton images of the tissue.
Research Impact
Citations
Available on Google Scholar
Field
Vascular Biomechanics and Soft Tissue Failure
Approach
Fiber-Embedded Finite Element Modeling and Spatial Autocorrelation (Moran’s I) Analysis